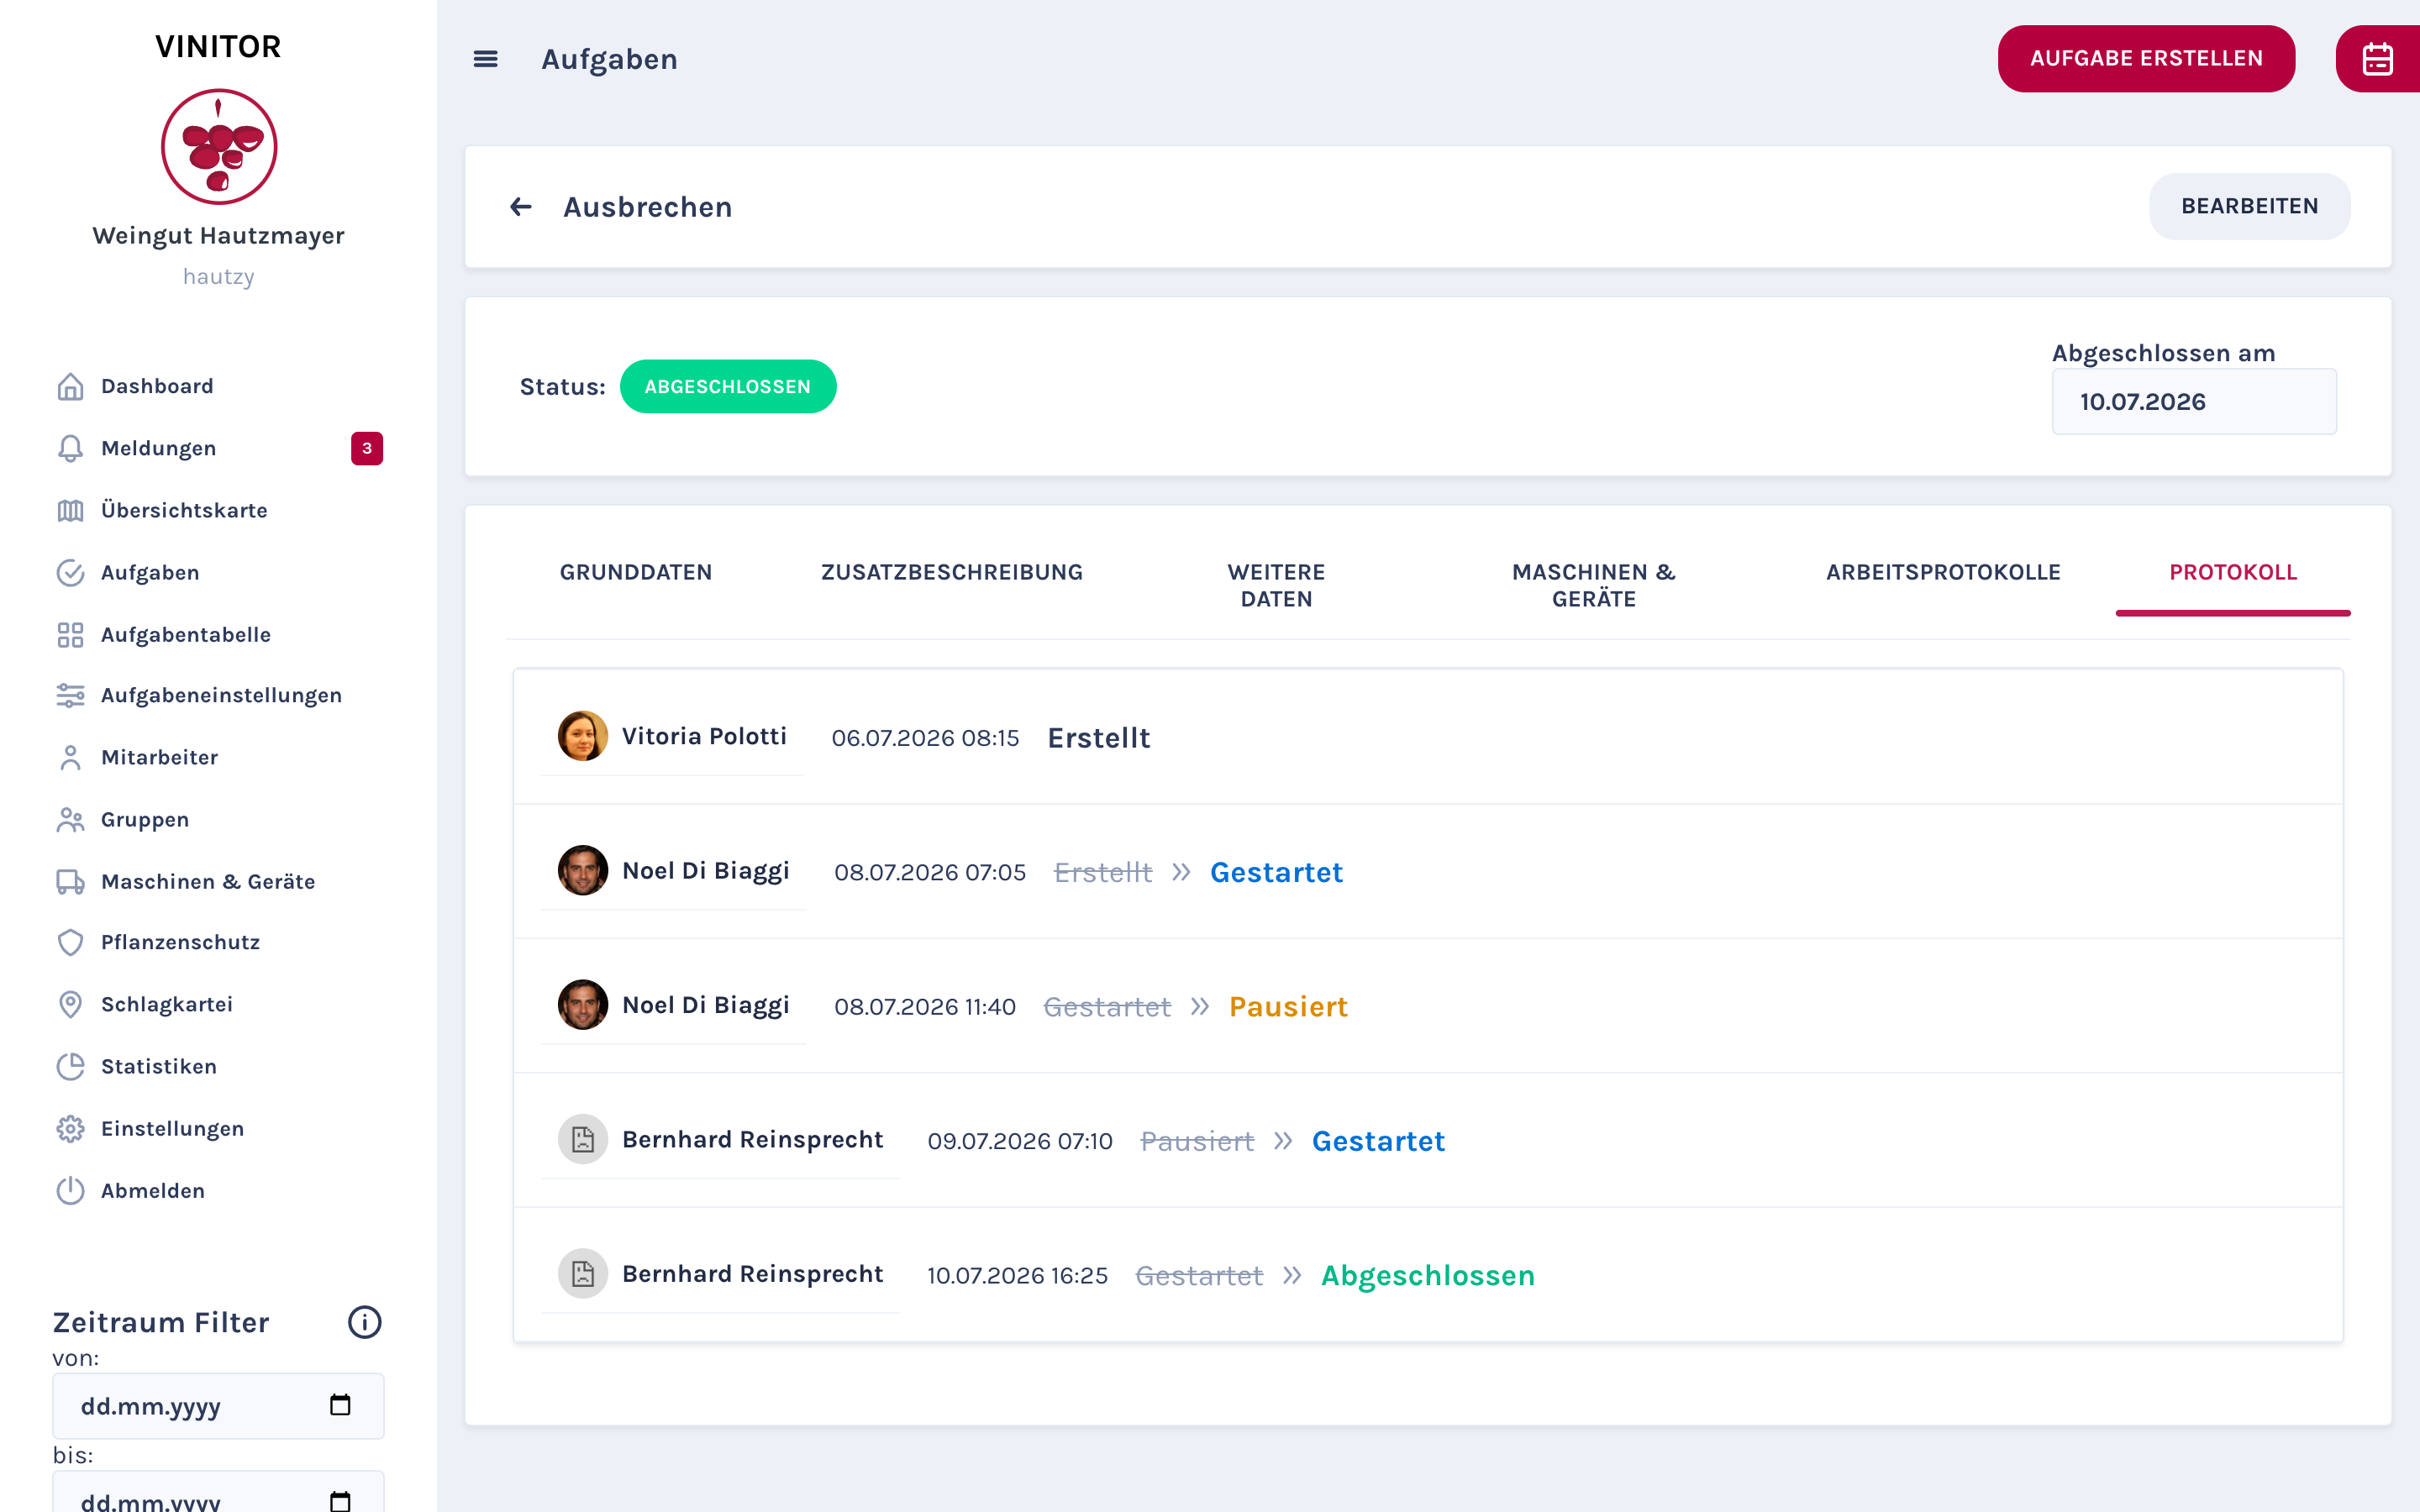
When a task moves from “planned” to “in progress” and then to “done”, you want to know: who did that? And when? The new task log documents every status change with a user and timestamp — as a timeline directly in the task detail page. This creates transparency and helps with traceability.
The spray plan has been optimised. The PDF export — one of the most frequently used functions — now sits as its own data export card right at the top, directly under the plan data. The dosage calculation now supports calculation by leaf wall area — a more accurate method than pure area calculation, because it takes the actual target area into account.
For each plant protection product a maximum pre-harvest interval can be stored. The validation automatically warns when an application is too close to the planned harvest.
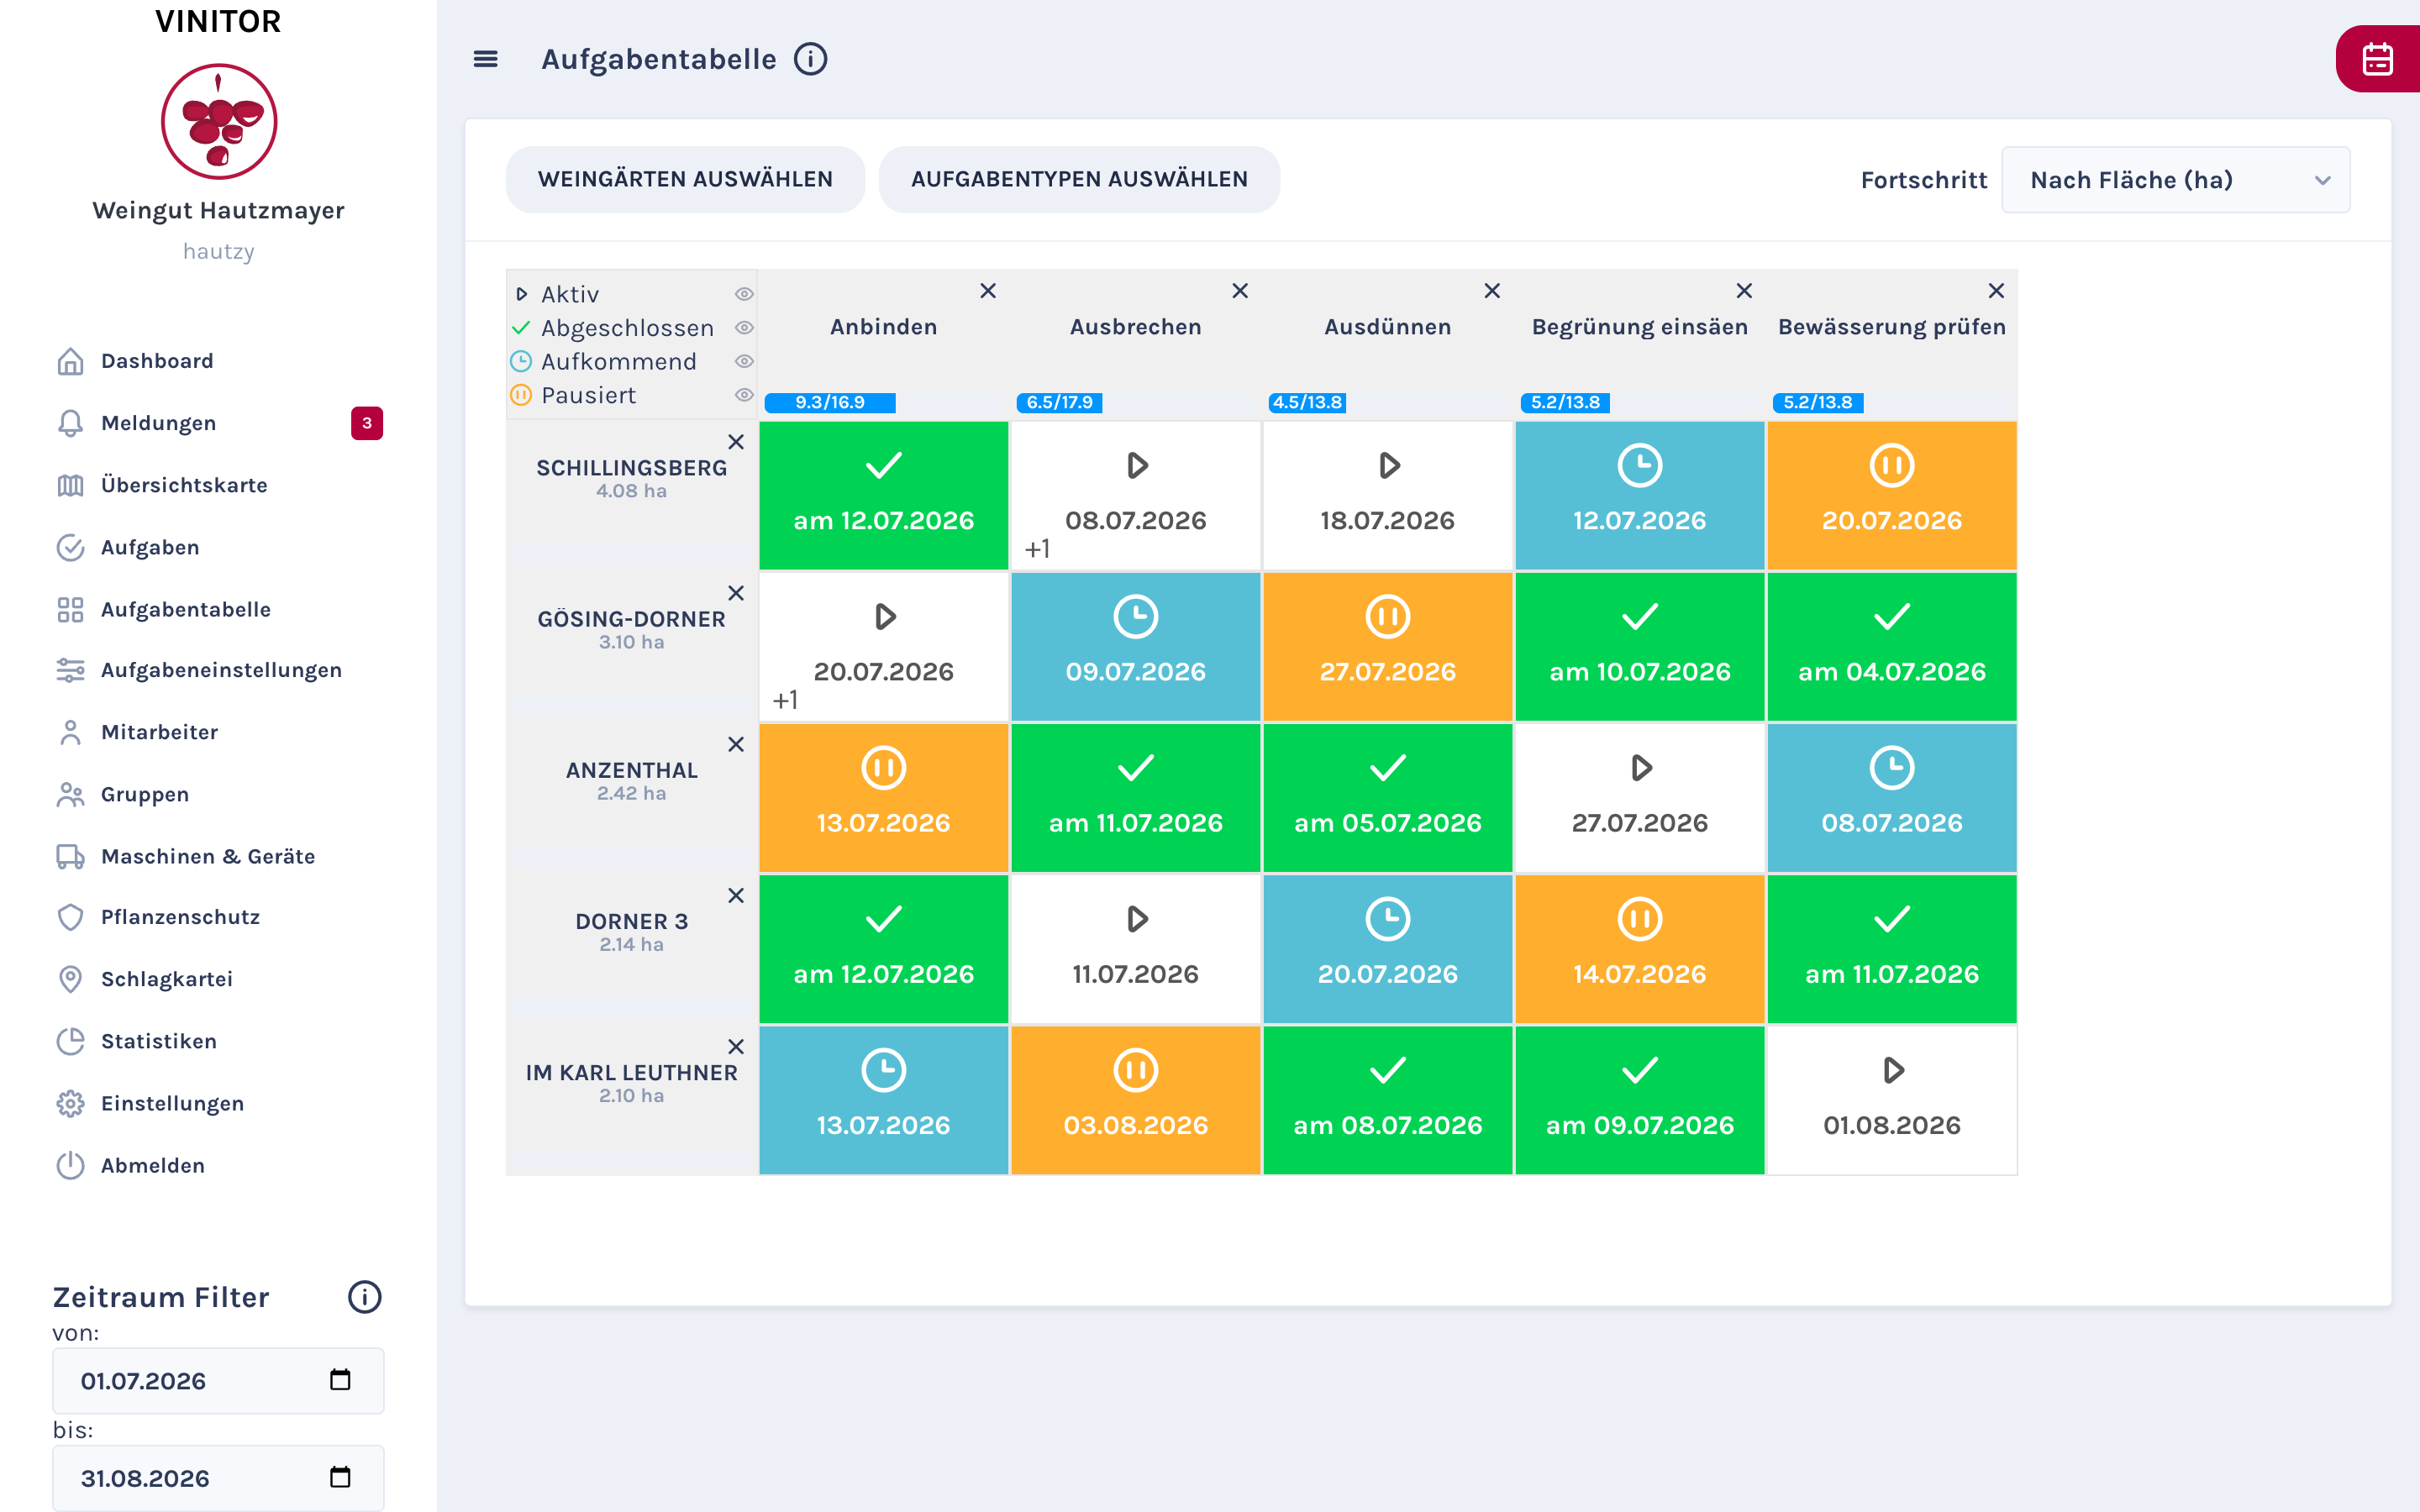
The task table has learned something too: progress per task type can now be shown by area in hectares instead of by number of tasks in percent — so you see at a glance how many hectares of a piece of work are already done.
✨ Improvements
- Task log — every status change is documented
- Spray plan optimisation with PDF export at the very top
- Calculation by leaf wall area for more accurate dosage
- Maximum pre-harvest interval configurable
- Task type highlighting on the overview map
- Info texts for plant protection products
- Progress display by hectare in the task table
- Nebular UI update for a more modern dashboard design